Debug JAR Files in IntelliJ IDEA
Originally published on LinkedIn (May 2015).
I was working on CloudML — a deployment engine for provisioning and deploying multi-cloud applications — where the most common way to deploy an application (among a few available interfaces) is launching the cloudml-shell.jar file and running the deploy command from there.
Running CloudML from a JAR file gets in the way of debugging: I’m not launching a main() method from IntelliJ IDEA directly, just running a JAR from the console (Alt+F12), so IntelliJ has no running process of its own to attach to.
The fix: launch the JAR in debug mode (via JDWP — Java Debug Wire Protocol) and then attach IntelliJ to the already-running JVM. Here’s the sequence:
-
Start the JAR with an extra flag (port is configurable — 5005 was IntelliJ’s default at the time):
java -jar -Xdebug -Xrunjdwp:transport=dt_socket,server=y,suspend=n,address=5005 your_jar_file.jar -
Create a Remote run configuration: Run → Edit Configurations → + → Remote.
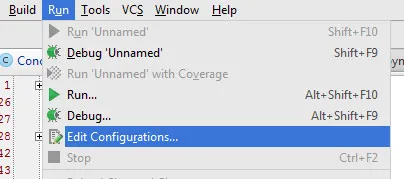
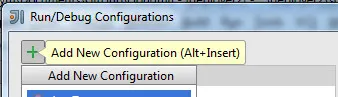
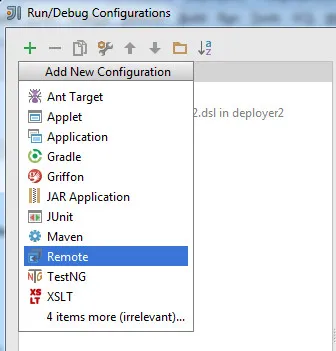
-
Leave the default options (transport: Socket, debugger mode: Attach, host:
localhost, port:5005), then Apply and OK.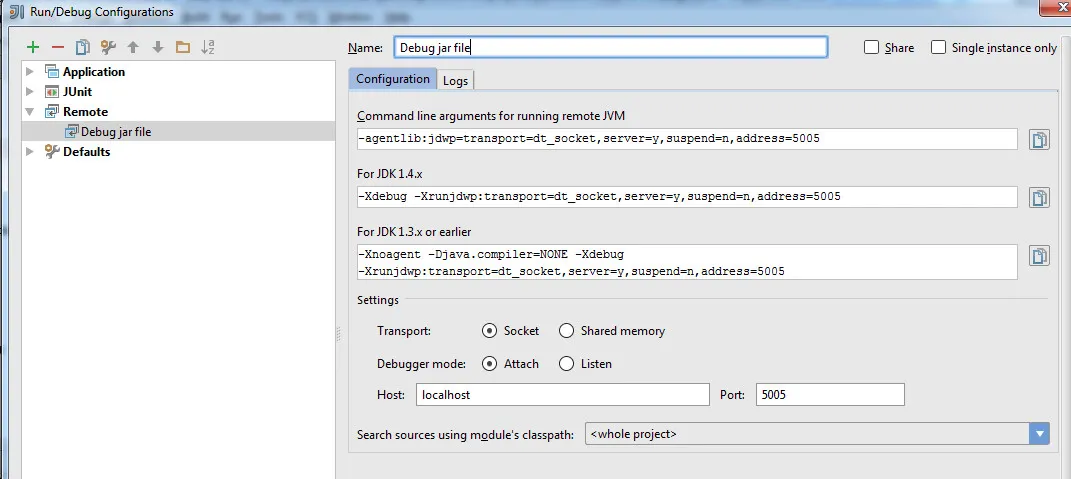
-
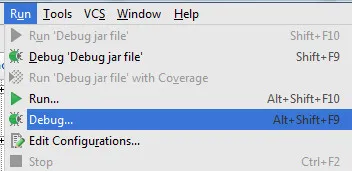
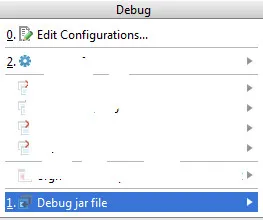
Since the JAR is already running, start the debug session directly — no need to launch anything new.
Hope this helps somebody.