
How We Reduced Our Google Cloud Bill by 65%
Originally published on the Brokee engineering blog (December 2024). The
brokee.iodomain was later sold and now redirects elsewhere; this copy, screenshots included, was recovered from the Internet Archive and lightly edited to remove company-update framing.
No matter if you’re running a startup or working at a big corporation, keeping infrastructure costs under control is always good practice — but it’s especially important for startups trying to extend their runway. That was our goal.
We just got a bill from Google Cloud for the month of November and were happy to see we’d reduced our costs by ~65%, from $687/month to $247/month. Most of our infrastructure runs on Google Kubernetes Engine (GKE), so most of these tips are GKE-specific. This is optimization at a small scale, but most of it applies at larger scale too.
TLDR
Sorted from biggest impact to least:
- Almost eliminated stable on-demand instances by moving most of the setup to spot instances, and minimizing how long stable nodes need to run
- Consolidated dev and prod environments
- Optimized logging
- Optimized workload scheduling
Some of these steps are interrelated, but each has a specific, separable impact on the cloud bill. Let’s dive in.
Stable Instances
The biggest driver of our cloud costs was running stable (on-demand, always-up) servers. We needed them for a few reasons:
- Some services didn’t have a highly-available (HA) setup (multiple instances of the same service)
- Some of our skills assessments run inside a single Kubernetes pod, and we can’t allow pod restarts — the candidate’s test progress would be lost
- We weren’t confident all of our backend services could handle a node restart gracefully
For services without an HA setup, the options were: build HA where possible (often requires extra infrastructure, especially for stateful apps, which itself costs money); migrate to a managed service (e.g., offload Postgres to a managed instance instead of running it ourselves); or accept 1–2 minutes of downtime a day if the service isn’t user-critical.
For example, we run a small Postgres instance on Google Cloud with very light load. When another backend component needs Postgres, we create a new database on the same instance rather than spinning up another one or running Postgres as a pod on our cluster. That’s not the right call for everyone, but it works for us — several lightly-loaded databases sharing one instance means we don’t have to think about node restarts or per-instance database management.
Similarly, we run a single instance of Grafana. It’s fine if it goes down during a node restart — it’s an internal tool, and we can wait a few minutes if we need a dashboard. Same logic applies to the ArgoCD server handling our deployments: it doesn’t need to be up all the time.
High Availability Setup
Here’s what we did to get most services off stable nodes entirely:
- Created multiple replicas of each service (at least 2), so if one pod goes down, another serves traffic
- Configured pod anti-affinity based on node name, so replicas always land on different nodes:
affinity:
  podAntiAffinity:
    requiredDuringSchedulingIgnoredDuringExecution:
      - labelSelector:
          matchExpressions:
            - key: app.kubernetes.io/name
              operator: In
              values:
                - pgbouncer
topologyKey: kubernetes.io/hostname- Added a PodDisruptionBudget (a Kubernetes rule capping how many replicas of a service can be down at once) with a minimum of 1 available pod for 2-replica services. This doesn’t guarantee protection, but with automated node upgrades enabled, it helps prevent GKE from killing a node when we don’t have a spare replica ready
- Reviewed
terminationGracePeriodSecondsfor each service to make sure apps have enough time to shut down properly - Updated some app code to handle unexpected shutdown correctly — a separate topic, but the key is making sure no critical data is lost and you can recover from whatever state a node shutdown leaves you in
- Moved these services onto spot instances — this was the actual cost-saving step; everything above was groundwork to make it safe
Experienced Kubernetes engineers can probably suggest further improvements, but this was enough for where we were.
Temporary Stable Instances
Then there’s the part of our workload that genuinely needs stable nodes: skills assessments, which we can’t easily move off stable infrastructure (yet — we have ideas).
We tried GKE’s node auto-provisioning. Instead of always-available stable servers, we dynamically create node pools with specific characteristics to run assessments as needed. The tradeoff: candidates starting an assessment wait an extra minute for the server to provision, versus the old setup where stable servers just sat waiting for pods. Not ideal, but worth it for the savings.
To keep other workloads off these stable nodes, we use taints and tolerations — Kubernetes’ mechanism for “only these specific pods are welcome on this node, everything else gets scheduled elsewhere”:
nodeSelector:
  type: stable
tolerations:
  - effect: NoSchedule
    key: type
    operator: Equal
    value: stable
We also add resource requests (and limits where needed) so auto-provisioning selects the right-sized node pool. When a pod is pending, auto-provisioning spins up a new node pool with the right size, labels, and tolerations.

Assessments run for a maximum of 3 hours and are then automatically torn down, letting the cluster autoscaler scale nodes back down.
A couple of things worth calling out. You need to actively manage resource requests, or pods can get evicted for using more than they’re allotted. In our case, we went through each assessment and noted its actual resource usage to size requests correctly. For an always-on workload, a vertical pod autoscaler could generate these recommendations automatically from usage metrics.
Also, the cluster autoscaler can decide to remove a node if usage looks low — so we added this annotation to prevent accidental pod restarts mid-assessment:
spec:
  template:
    metadata:
      annotations:
        cluster-autoscaler.kubernetes.io/safe-to-evict: 'false'
Together, this gives us temporary stable nodes on demand. We use a backend service to tear down deployments after 3 hours max; GKE auto-provisioning also has its own mechanism for capping node lifetime.
Optimizations
While testing this, we noticed auto-provisioning tended to pick slightly oversized nodes. It also has a cold-start cost: a pending pod started in 1m53s on an existing node pool versus 2m11s on a freshly created one.
So we made a couple more changes:
- Pre-created several node pools of different sizes with 0 nodes by default and autoscaling enabled, all sharing the same labels and taints, so the autoscaler picks the most efficient one. Cheaper than relying on auto-provisioning alone
- Chose older instance types where reasonable — GCP’s N1 generation instead of the newer, pricier N2 — for further savings
This also got us faster test provisioning, since node pools already exist, while auto-provisioning stays as a fallback if we forget to pre-create a pool for a new test. We’re also considering one-node-per-test isolation for resource-hungry tests (e.g., React environments), achievable with the same labels-plus-anti-affinity approach, on a case-by-case basis.
Consolidated Dev and Prod
Spot instances and auto-provisioning dealt with the biggest line item. The second-biggest turned out to be something we’d never really questioned: we ran two of everything.
We run a simple two-environment setup: dev and prod, each with its own GKE cluster and Postgres database (plus other things unrelated to cost).
At a Kubernetes meetup in San Francisco, I came across vcluster — it creates virtual Kubernetes clusters inside a real cluster, giving developers isolated environments without touching the underlying cluster. We moved our dev environment from a separate GKE cluster into a virtual cluster inside prod. That got us:
- No separate GKE cluster — Google now charges a cluster-management fee on top of node costs, so removing a whole cluster matters even before counting nodes
- Shared nodes between dev and prod — even an empty node costs roughly 0.5 CPU / 0.5 GB RAM just to exist, so fewer nodes is strictly better
- Shared infrastructure — no need for two Grafana instances, two Prometheus Operators, etc. It’s the same physical infrastructure, monitored together; isolation between virtual clusters happens at the namespace level with some renaming logic
- Fewer load balancers — vcluster lets you share ingress controllers (and other resources) between clusters in a parent-child relationship
- One database, not two — we moved the dev database onto the prod instance. Not a required step, but we were optimizing aggressively
We hit some friction with IAM setup during the migration — some functionality needed a vcluster subscription — but found a workaround. There are real tradeoffs to this setup in terms of isolation and availability, but at our scale the tradeoff was worth it, and we can revisit as we grow.
Cloud Logging
The last item on the list wasn’t something we set out to fix — it was something I stumbled into while checking whether the other two changes had actually landed.
Reviewing last month’s billing, I noticed daily charges for Cloud Logging even though I couldn’t recall enabling anything like Managed Prometheus.
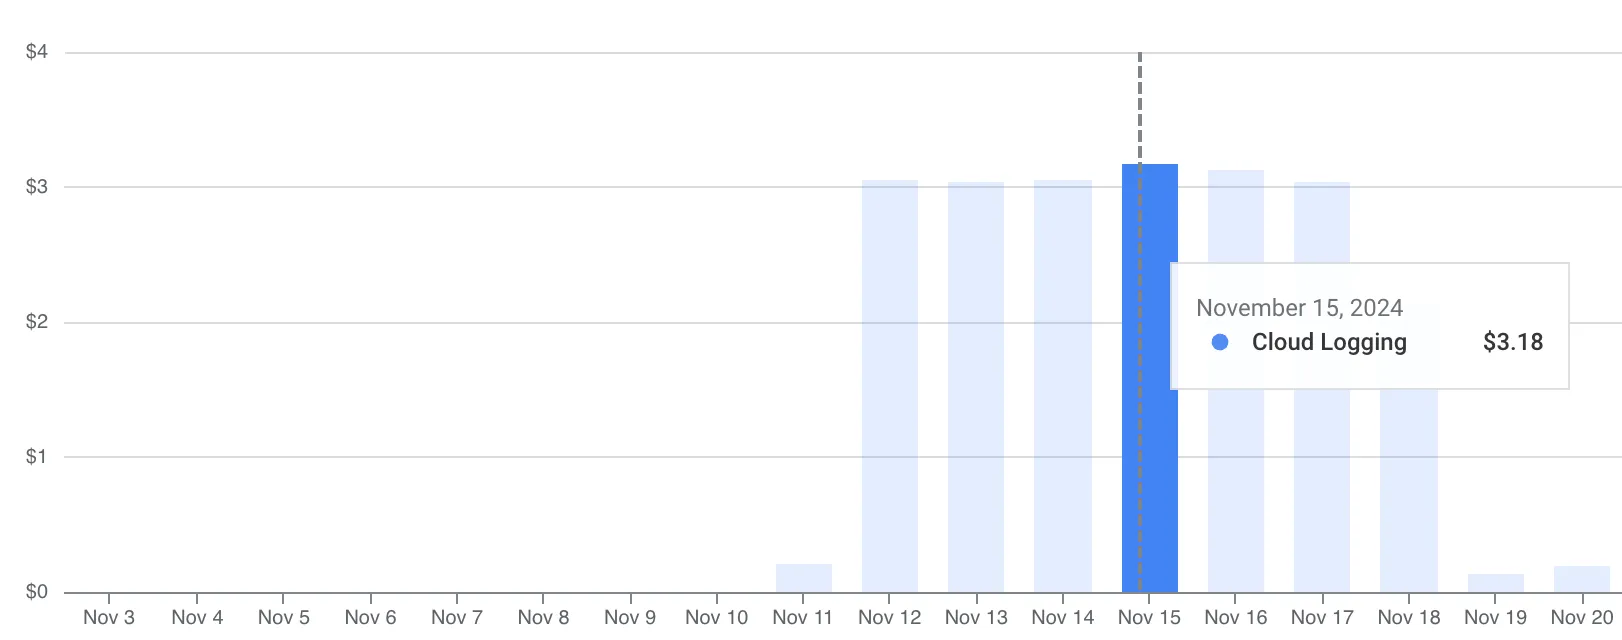
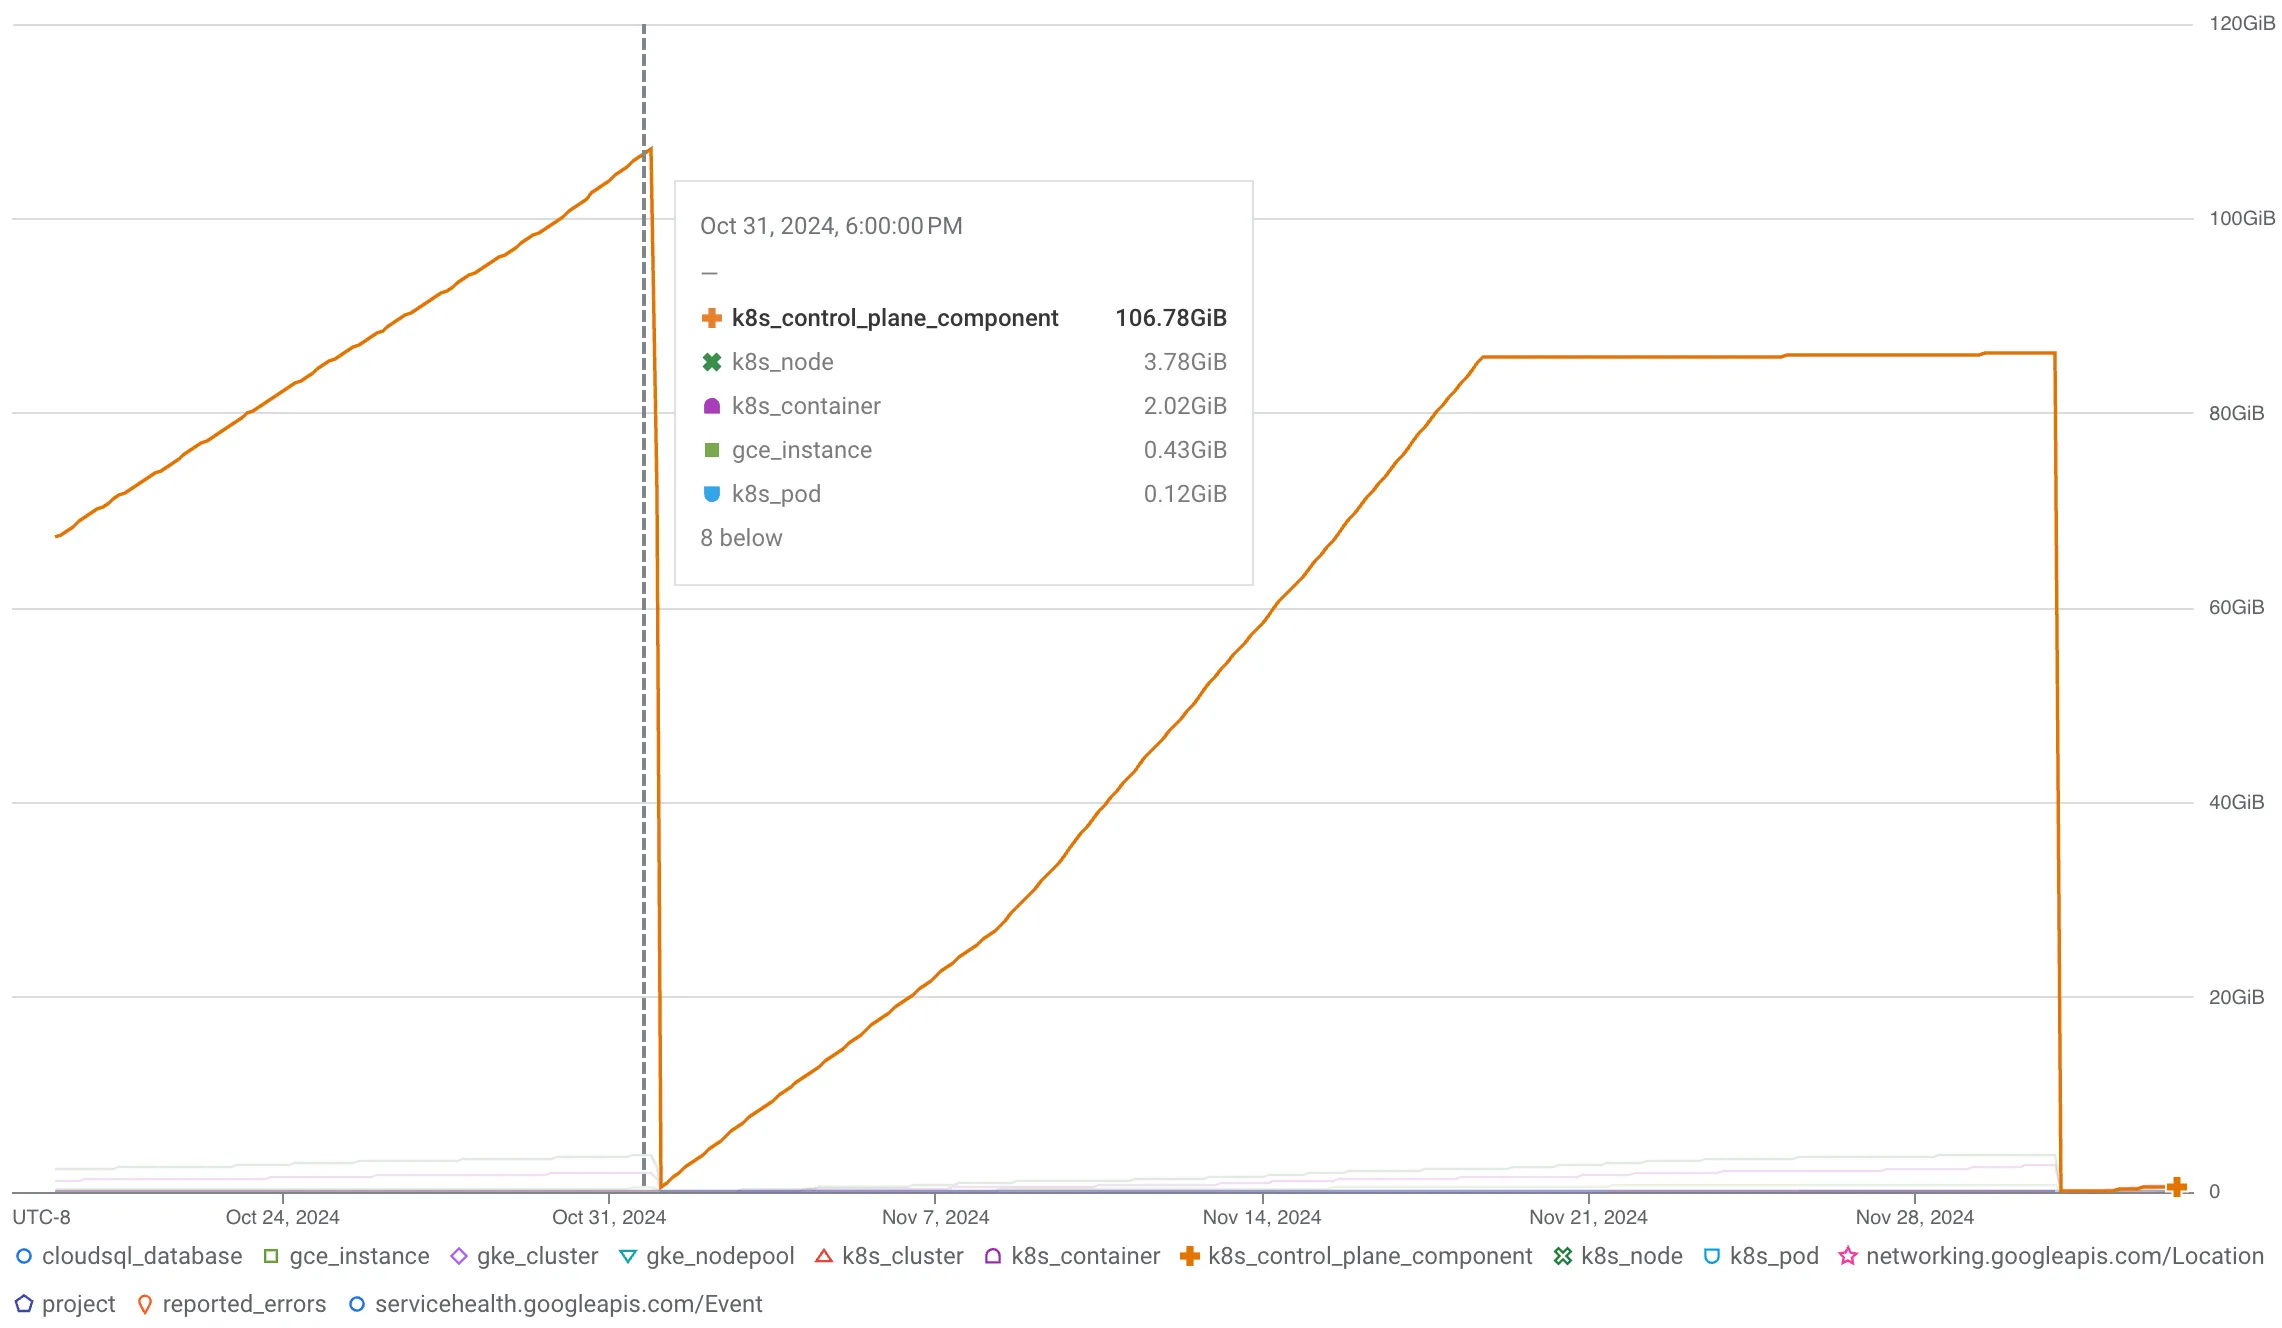
That would have meant close to $100/month for logs I couldn’t account for — and it was odd that the charges only started mid-month. After investigating, I found the cause: GKE control-plane components were generating 100GB of logs every month. The reason the charges appeared mid-month is that there’s a 50GB free tier — no charges for the first two weeks, then billing kicks in once you cross the threshold.
We’d already partly optimized by disabling logging for user workloads:
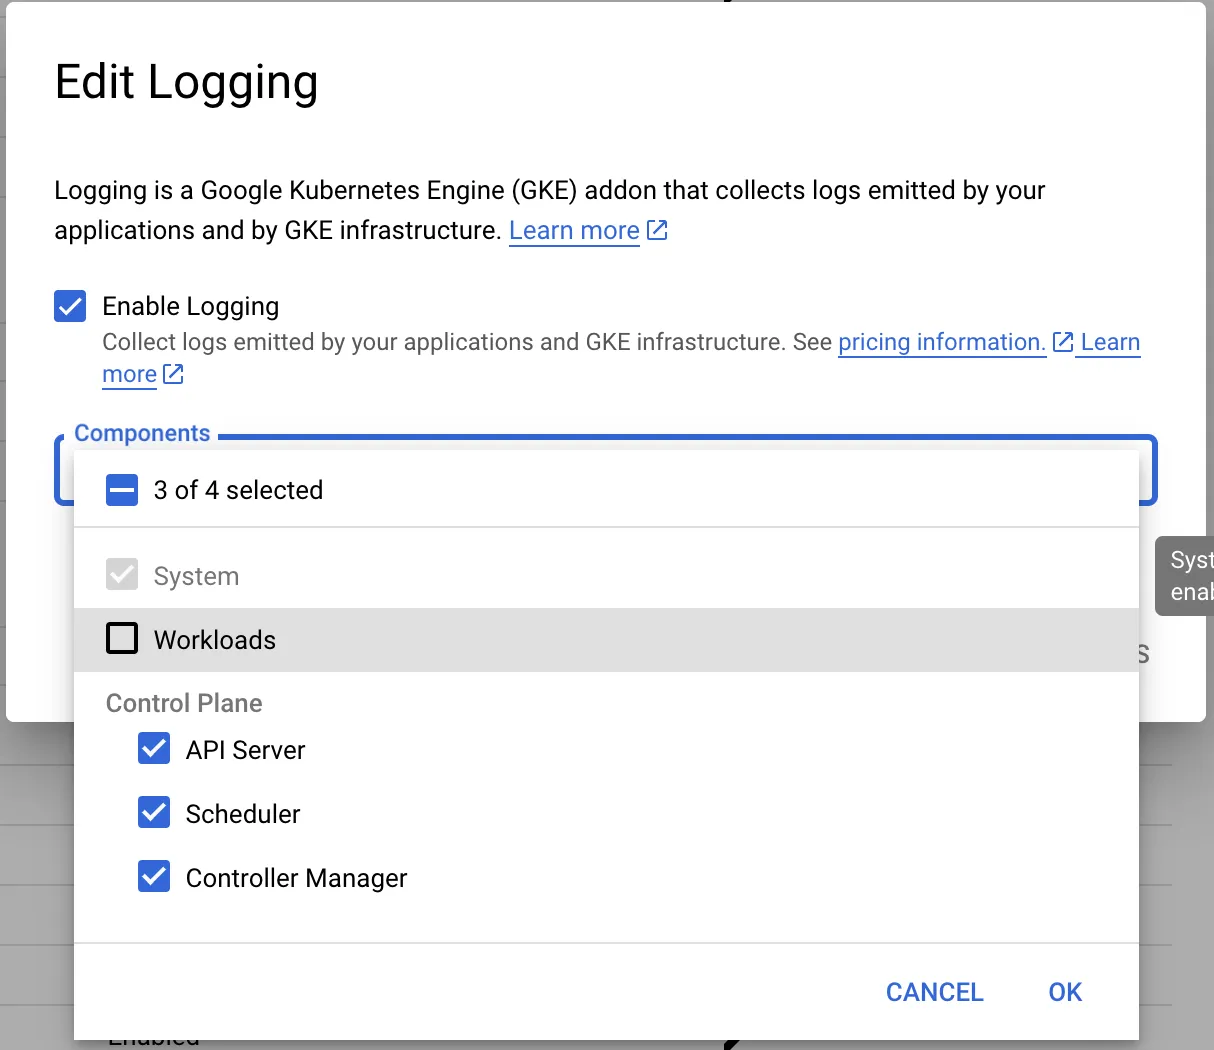
We wanted to keep control-plane logs available for troubleshooting, but 100GB/month was excessive. Digging further, most of the volume turned out to be info-level logs from the API server — generally low-value for debugging. To fix it, we added an exclusion rule to the _Default Log Router sink to drop API-server info logs:
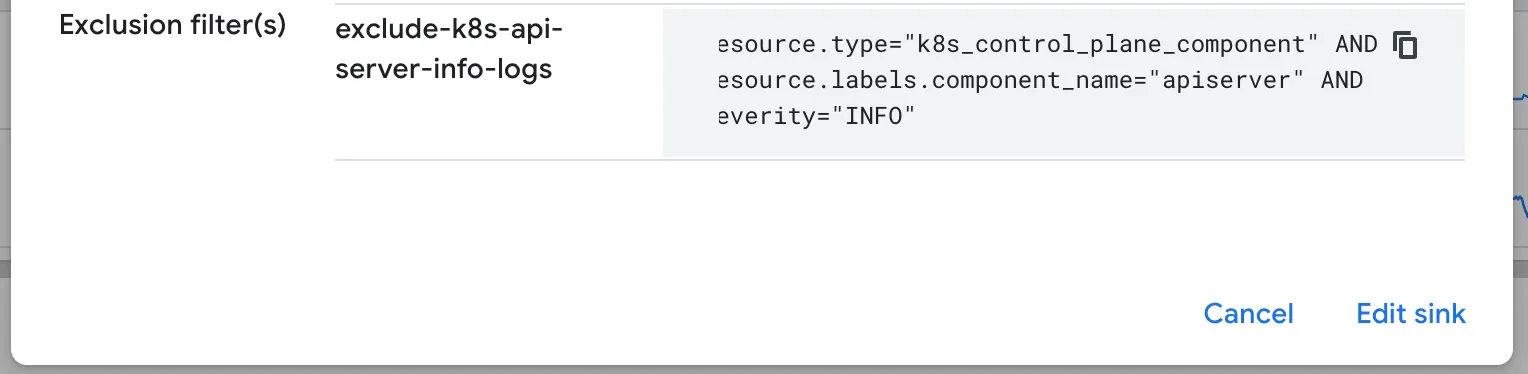
Log volume flattened out immediately after applying the filter, and GKE logging costs are now under control. We also added a budget alert specifically for Cloud Logging, to catch anything like this earlier next time.
Conclusion & Next Steps
We wanted to see how far we could get without relying on committed-use discounts or reserved instances — those still cost money and carry their own risk depending on whether you commit for 1 or 3 years. Now that costs are down significantly, committed-use discounts become a much lower-risk option to layer on top.
Hopefully this gives you a few ideas for your own infrastructure — most of these decisions apply across cloud providers, not just GCP.