Monitoring Kubernetes Ingress with BlackboxExporter
Originally published on Medium (June 2020).
Blackbox Exporter is a standard tool for monitoring endpoints with Prometheus. Most examples you’ll find online show you how to monitor a static list of endpoints. That’s easy enough in small deployments, but easy to forget to update once you have multiple clusters, or you’re adding new Ingress resources to your clusters often. Maintaining that kind of monitoring setup gets cumbersome and painful fast.
Prometheus provides a discovery mechanism for Kubernetes resources, including Ingress. Here’s what the job looks like:
## Monitor Kubernetes ingress endpoints
- job_name: blackbox
  metrics_path: /probe
  params:
    module: [http_2xx]
  kubernetes_sd_configs:
    - role: ingress
  relabel_configs:
    # 1. Set ingress address protocol to https, so we can make sure certificates are valid while probing endpoints
    - source_labels: [__address__]
      regex: (.*)
      action: replace
      replacement: https://$1
      target_label: __param_target

    # 2. Save address in an instance label since __param_target is going to be dropped
    - source_labels: [__param_target]
      target_label: instance

    # 3. Replace address with an internal blackbox service so scraper is always pointed at blackbox-exporter
    - target_label: __address__
      replacement: blackbox-exporter:9115
This job covers the simple case, where your Ingress resources are separate domains with a root path for scraping, like https://test.example.com/. If you delete the first rule, tests run over plain HTTP instead — which doesn’t always work well. Without an HTTPS request, you won’t know if your domain certificate has expired, for instance.
Blackbox Exporter has a simple UI showing the result of each test and the concrete steps along the way — DNS resolution, redirects. Check it out via port-forwarding:
kubectl port-forward svc/blackbox-exporter 9115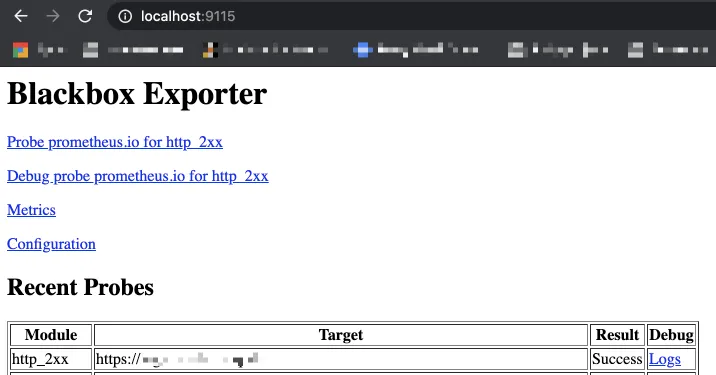
And you can drill down into the debug logs from there:
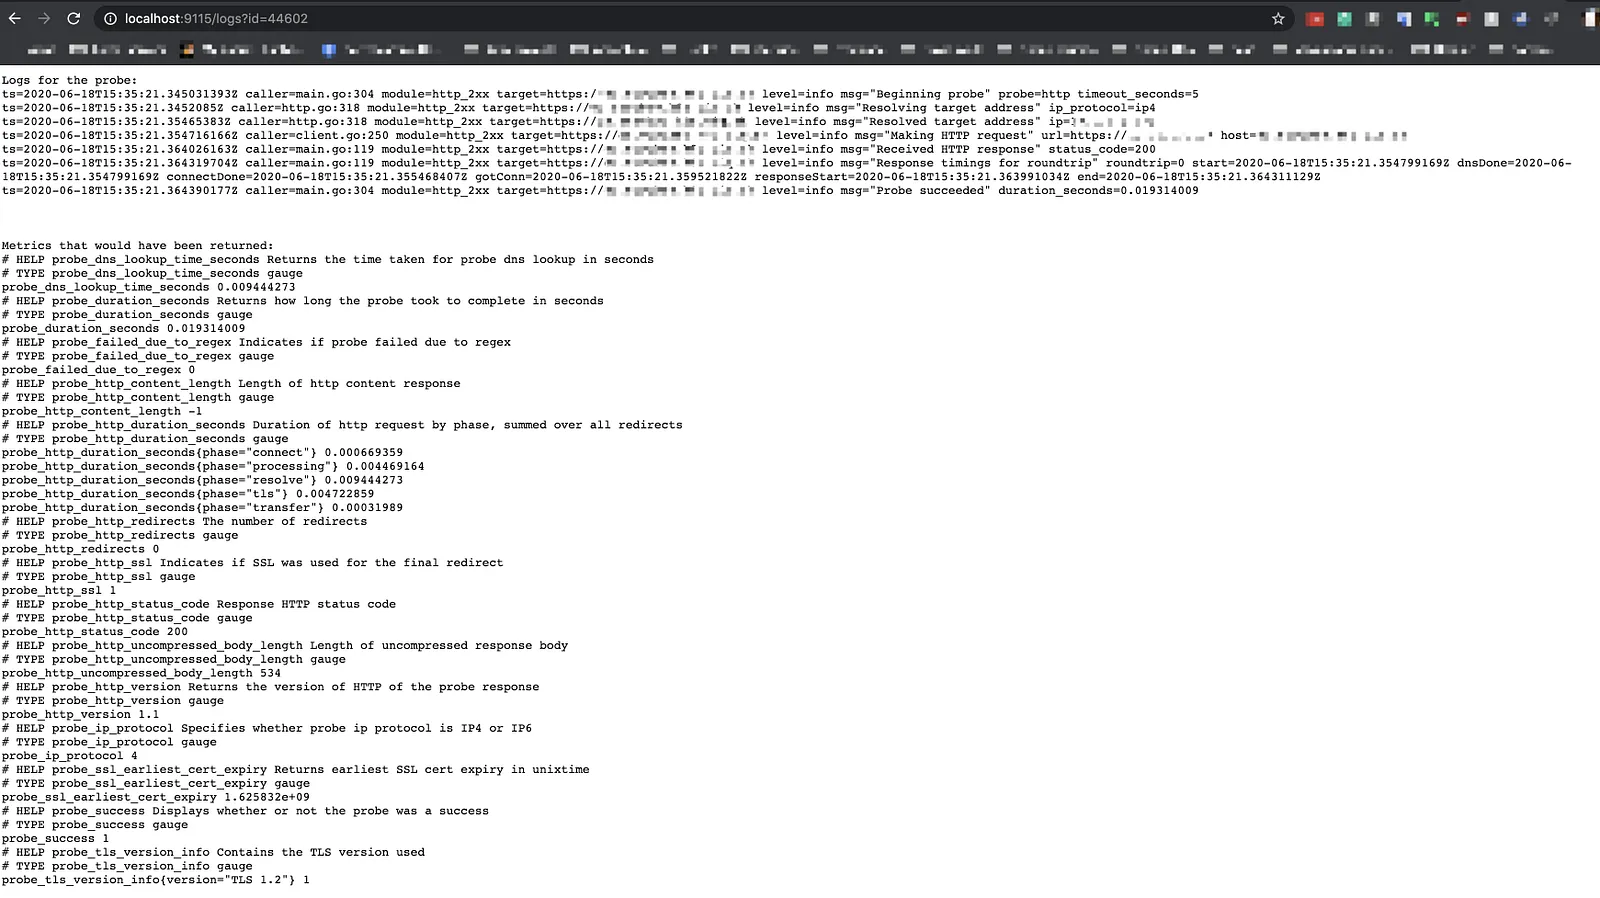
So with a single query, you know at least the following:
- DNS is working
- The domain certificate hasn’t expired
- The load balancer is working (or the NodePort is open in your firewall)
- Network policies aren’t blocking ingress traffic (assuming you’re using them)
- The Kubernetes Service is properly configured
- The Kubernetes pod is up and healthy (assuming your liveness and readiness probes actually validate application health)
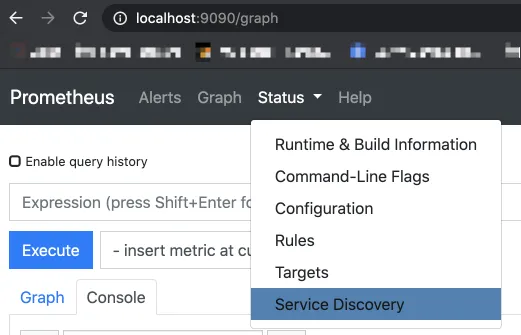
If you have a more sophisticated Ingress setup, you may need to tune the job’s relabel_configs. How do you figure out what data is actually accessible to Prometheus? Check the discovery tab:
Then click the Blackbox job to see every discovered Ingress resource and its available labels:
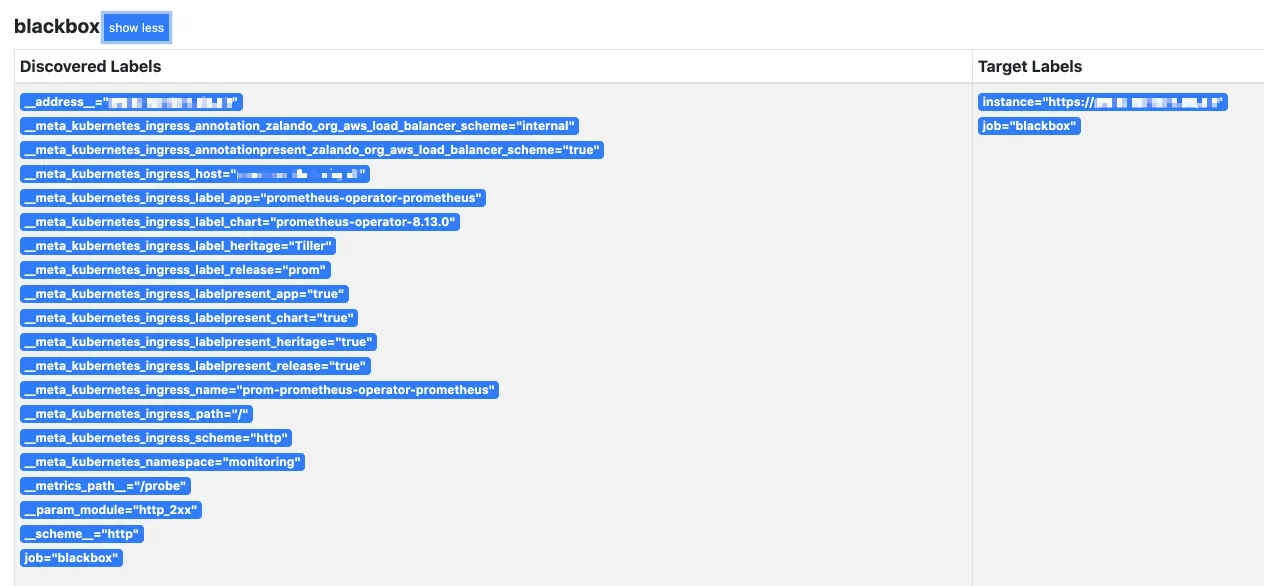
Based on the available labels, your Prometheus job could look like this:
# Example scrape config for probing ingresses via the Blackbox Exporter.
#
# The relabeling allows the actual ingress scrape endpoint to be configured
# via the following annotations:
#
# * `prometheus.io/probe`: Only probe services that have a value of `true`
- job_name: 'kubernetes-ingresses'

  metrics_path: /probe
  params:
    module: [http_2xx]

  kubernetes_sd_configs:
    - role: ingress

  relabel_configs:
    - source_labels: [__meta_kubernetes_ingress_annotation_prometheus_io_probe]
      action: keep
      regex: true
    - source_labels: [__meta_kubernetes_ingress_scheme, __address__, __meta_kubernetes_ingress_path]
      regex: (.+);(.+);(.+)
      replacement: ${1}://${2}${3}
      target_label: __param_target
    - target_label: __address__
      replacement: blackbox-exporter.example.com:9115
    - source_labels: [__param_target]
      target_label: instance
    - action: labelmap
      regex: __meta_kubernetes_ingress_label_(.+)
    - source_labels: [__meta_kubernetes_namespace]
      target_label: kubernetes_namespace
    - source_labels: [__meta_kubernetes_ingress_name]
      target_label: kubernetes_name
One catch: __meta_kubernetes_ingress_scheme always returned HTTP on our clusters, likely because we managed certificates outside of Kubernetes. Given that, I’d still either hardcode the protocol to HTTPS or add an extra label on the Ingress resource specifying the protocol, if certificates are managed separately.
Finally, if you’re using an Ingress controller with its own API spec — Istio, for instance — you’ve got a few options:
- Contribute Kubernetes service-discovery support for that API upstream to Prometheus.
- Fall back to a static list of servers, as in most examples.
- Use file-based discovery.
That last option works with a small extra app and a shared volume between Prometheus and the app responsible for ingress discovery: the app lists your gateways and writes them to a file in the right format, and Prometheus picks up changes to that file and probes the listed endpoints through Blackbox Exporter.